Every fan has a hot take, but when you actually compare baseball players, batting average and home run totals never tell the whole story. Ballparks, roles, eras, and even sample size can quietly tilt the numbers and flip who really comes out on top. In this FlagOh Fanatics guide, you’ll see how to move beyond screenshot arguments and start reading player stats in context, so your next debate—or fantasy move—rests on more than a box score. The ranges and rules of thumb in this guide follow commonly used public numbers from sites like Baseball Reference, FanGraphs, and MLB’s Statcast data.
A Simple, Clear Way to Compare Baseball Players
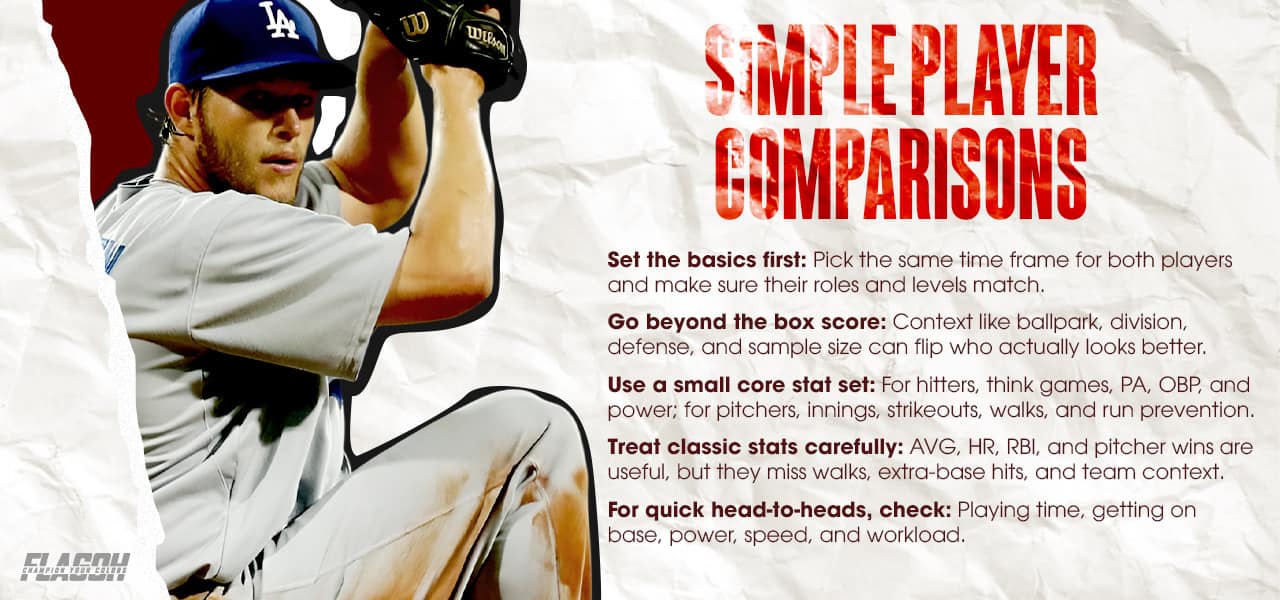
It’s tempting to skim a few big numbers and call it a day, but that rarely works if you want to compare baseball players fairly and consistently. This section gives you a straightforward process: define the time frame, match roles, and use a small set of easy stats so you can see how each player actually helps their team.
Why Player Comparisons Are Tricky
On the surface, it feels easy to stack two names side by side and pick the one with bigger numbers. One line says .285 with 25 homers, the other says .260 with 18, and the answer seems obvious. But that box score view hides all kinds of context: one hitter might face tougher pitching in a different division, play half his games in a pitcher’s park, or carry a much heavier defensive load.
The question itself is often fuzzy, too. Are you talking about who was better this season, who had the stronger three-year peak, or who you’d build a franchise around over the next five years? Each version needs a different lens. Until you’re clear on what you’re comparing (single year vs prime vs career) and why (front-office view, fantasy value, fan debate, coaching decision), the numbers won’t really answer what you think they’re answering.
Simple Steps for Player Comparisons
Before diving into advanced analytics, you can get a lot of clarity from a simple, structured process:
Step 1: Define the time window
Decide on one shared time window for both players (for example, the same season or the same three-year span), and avoid mixing one player’s peak years with another’s decline phase.
Step 2: Align the sample
Pull stats from the same seasons, same level, and same type of games (regular season only, or regular plus postseason for both). Put the lines in one small table so you’re not bouncing between tabs.
Step 3: Start with a core stat set
For hitters, focus on games, plate appearances, on-base percentage, and some measure of power. For pitchers, look at innings, strikeouts, walks, and run prevention. This illustrates how each one contributes on a per-opportunity basis, rather than just who accumulated the most totals.
Step 4: Look for patterns, not just winners
Instead of circling the bigger number and moving on, ask what kind of profile you’re seeing: OBP-heavy table-setter, slugger with lower on-base skills, high-strikeout ace, control artist, volume workhorse, and so on. Once that basic picture is clear, the more advanced tools later in the article can refine the judgment rather than overturn it.
The Limits of Traditional Stats
Classic stats are easy to read, but they miss a lot. Batting average ignores walks, so a .270 free-swinger can help less than a .255 hitter who reaches base more often. Home runs don’t show doubles, triples, or how the ball is hit, and RBI or pitcher wins depend heavily on teammates, ballpark, and luck. That doesn’t make the box score useless, but it should be your starting point, not your finish line—real insight comes when you combine those familiar numbers with stronger measures of getting on base, overall value, and context.
Easy Head-to-Head Comparison Table
Here’s a simple table you can drop into a spreadsheet any time you want to line two players up side by side:
| What do you want to see | Stat to check | For | How to read it quickly |
| Do they play a lot? | Games, PA, IP | Both | Higher = bigger role, more trust. |
| Do they get on base? | OBP | Hitters | Around .320 is OK; higher is better. |
| How much power do they have? | SLG, extra-base hits | Hitters | More hard-hit extra-base hits = more runs. |
| Do they pressure with speed? | Stolen bases (SB) | Hitters | More SB = more pressure on pitchers/defense. |
| Do they carry innings? | Innings pitched (IP) | Pitchers | Higher = workhorse, key starter/reliever. |
If some of the abbreviations in the table look unfamiliar, here’s a quick cheat sheet so you can read the numbers with confidence before diving further into the analysis:
- OBP (On-Base Percentage): Shows how often a hitter reaches base. Around .320 is average; higher is better.
- SLG (Slugging Percentage): Measures power by counting extra bases from each hit. Higher SLG usually means more damage per swing.
- K% (Strikeout Rate): Percentage of plate appearances that end in a strikeout. Higher for power pitchers who miss a lot of bats.
- BB% (Walk Rate): Percentage of plate appearances that end in a walk. Lower is better for pitchers because it means fewer free bases.
- IP (Innings Pitched): How many innings a pitcher has thrown. A high IP total usually means a durable, trusted arm.
With that framework in place, every box score becomes easier to read, and your takes get a lot sharper—whether you’re settling debates with friends or looking for smart matchups to turn into game-day designs inspired by FlagOh.
Advanced Stats to Fairly Compare Baseball Players
In this section, we focus on three tools that deepen your view of performance: WAR for overall value in wins, adjusted stats for context, and modern tracking data for contact quality versus results.
What WAR Says About Value
WAR (Wins Above Replacement) tries to answer one big question: “How many extra games would an average team win with this guy instead of a cheap call-up or bench piece?”
A few things make WAR useful in a way that simple stat lines aren’t:
- It bakes in position difficulty: Shortstop and catcher are simply harder jobs than first base or left field. If two players hit the same, the one at the tougher position will usually post higher WAR because it’s harder to find someone else who can do that job at all.
- It treats runs as the currency: All the little things—extra bases, stolen bags, double plays avoided, balls turned into outs—are converted into runs, then into wins. A common rule of thumb in modern MLB is about 9–10 runs ≈ 1 win, so a 4-WAR season means roughly forty runs better than replacement level.
- It’s time-frame flexible: You can look at WAR for a month (small sample, noisy), a season, a three-year prime, or an entire career and keep everything in the same “wins” language.
For reading WAR, rough tiers help:
- Around 1–2 WAR in a full season: useful bench piece or lower-end regular
- 2–4 WAR: solid everyday starter
- 4–6 WAR: All-Star level impact
- 6+ WAR: genuine MVP-type season
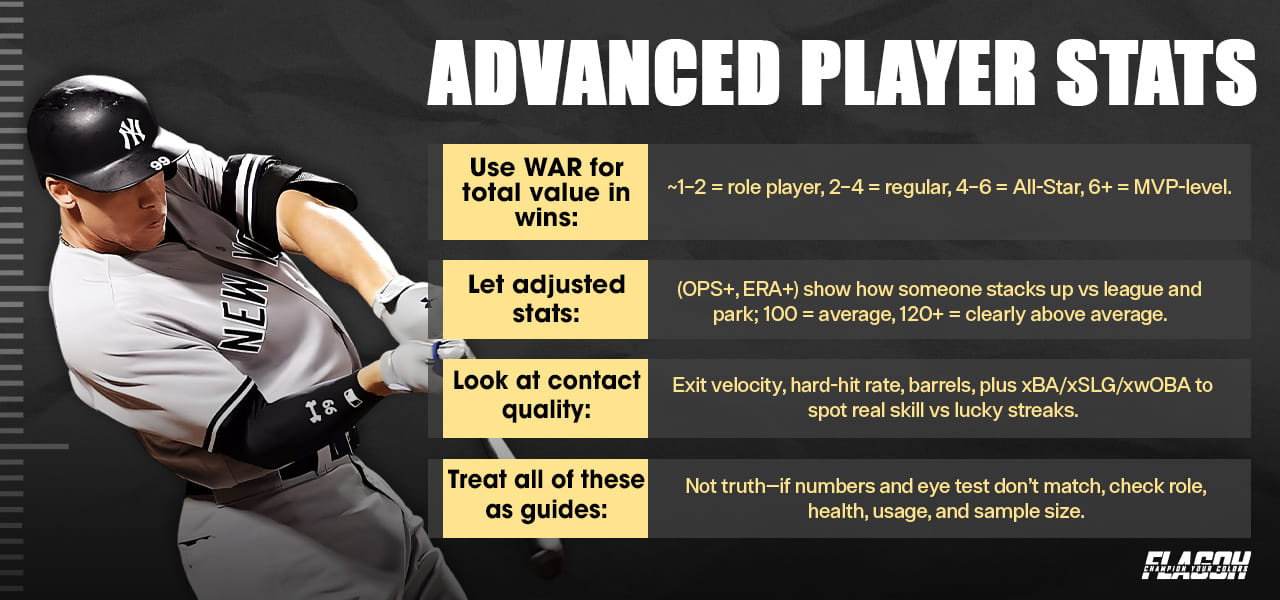
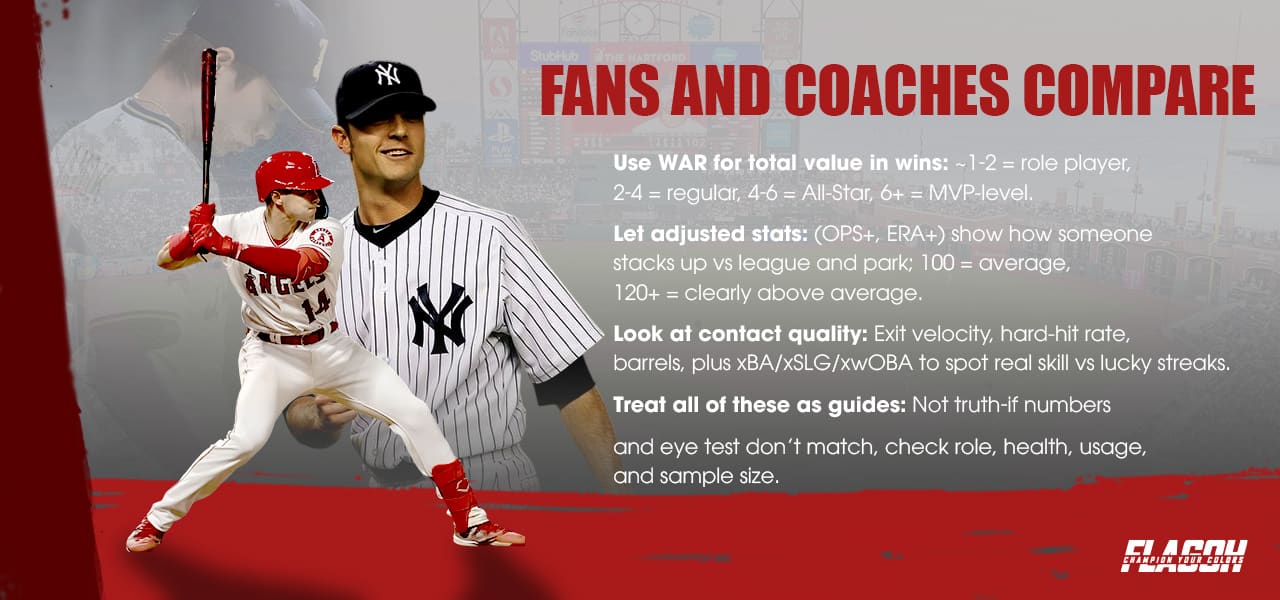
You’ll see WAR differ slightly from site to site, and that’s normal because each one scores defense and pitching a bit differently. The important part is the range: roughly 1–2 WAR in a season is a role player, 4–5 is a clear star, and anything far above that is award-level. Treat WAR as a quick measure of impact, then check the other stats and context to see how the player created that value.
Using Adjusted Stats for Context
Adjusted stats exist because players don’t all hit and pitch under the same conditions. Ballparks, run-scoring levels, and even leagues can be very different from one another. Instead of only showing raw OPS or ERA, adjusted numbers try to show how a player performed compared to the average in that specific context—their league, their era, and their home park. This makes it much easier to see who is truly above or below “normal” once you account for where and when they played.
Both are scaled so that 100 = league average in that context. Numbers above 100 are better than average; numbers below 100 are worse. Rule-of-thumb ranges you’ll often see:
- Around 80: below average
- 100: roughly average
- 120: clearly above average (about 20% better than league context)
- 140+: star-level performance
What makes this powerful is that it quietly does the annoying math for you. Imagine:
- Hitter A plays in a tiny, hitter-friendly park and posts an OPS of .850.
- Hitter B plays in a big, pitcher-friendly park and posts an OPS of .800.
On the surface, A “wins.” But if A’s OPS+ is 115 and B’s is 130, that means B is doing more damage relative to what hitters usually do in their parks and leagues.
Making Sense of Hitting Data
Modern tracking stats let you see more than just hits and home runs. Exit velocity and hard-hit rate show how strongly a player usually strikes the ball, while barrel rate shows how often that contact is good enough to produce extra-base hits or homers. When those three are consistently high, the underlying power is usually real, not just a hot week.
“Expected” numbers such as xBA, xSLG, and xwOBA, then compare the quality of contact to the actual results. If the expected line is much higher than the real one, the hitter may have been a bit unlucky; if it is much lower, the current production may be hard to sustain.
Even without learning every advanced stat, focusing on how hard the ball is hit, how often it is hit well, and whether the results match that contact already gives you a much clearer reading of a hitter’s true level.
Together, these tools turn opinions into evidence and highlight who’s really driving performance on the field—great fuel for smarter debates and the rivalry storylines you might later turn into game-day designs from our store. Just remember no single metric has all the answers: use WAR, OPS+, and expected stats as guides, and if they don’t match what you see, it’s usually a cue to look closer at role, health, usage, or small-sample noise.
How Fans and Coaches Use Player Comparisons
Different people compare baseball players for different reasons—fantasy managers chasing categories, coaches setting fair youth lineups, or fans debating Hall of Fame legacies—but in each case, the goal is to turn stats and context into clearer decisions, not just louder opinions.
Comparing Players for Fantasy Drafts and Trades
In fantasy, the question is never ‘who is the better real-life player?’ but rather ‘who helps my roster win this scoring format?’ A power bat with 30 home runs can be less valuable than a balanced hitter who fixes your runs, steals, and average. Start by reading your league rules, then look at projections and playing time, not just last year’s box score. In most standard 5×5 leagues, for example, we’ve seen balanced hitters with 15–20 homers and solid OBP outscore a one-dimensional slugger simply because they quietly win runs, average, and steals over six months.
- In category leagues, think in terms of needs: power, speed, average/OBP, saves, strikeouts, ratios.
- In points leagues, focus on total volume, plate discipline, and innings.
Often, the right decision is the player whose stat profile fills your gaps, even if the name on the other side feels more famous.
Comparing Youth and Amateur Players Fairly
At lower levels, evaluation should serve development first. Short schedules, small sample sizes, and uneven competition make big stats swings almost meaningless on their own. Simple numbers like how often a hitter reaches base, or how often a pitcher throws strikes, can help, but they need to be read alongside what coaches see every day.
A fair picture blends three things: basic results over time, awareness of the game (cutoffs, baserunning, backing up plays), and attitude—effort in practice, response to mistakes, and how a player treats teammates. Lineups and positions become much easier to explain when families can see that decisions come from both performance and behavior, not one hot weekend at the plate.
Comparing Careers in Hall of Fame and GOAT Debates
When the conversation moves to Hall of Fame or “all-time” debates, you’re judging full careers, not single seasons. The key is to separate how long a player stayed at a high level from how high their peak really was. Looking at total value, a clear prime window (for example, the best five to seven years), and context like era and postseason impact turns vague greatness talk into a sharper question: How far above a normal star they played, and for how many years they maintained that level.
These angles give you practical ways to apply the same tools in leagues, dugouts, and long-term debates, and they also shape the rivalries and player stories you might eventually turn into game-day flags and decor from FlagOh Fanatics.
Questions When You Compare Baseball Players
Most fans who try to compare baseball players end up circling the same doubts: which stats matter, how much playing time is “enough,” what to do with WAR, or how to handle different eras. This FAQ pulls those recurring questions into one place so you can get quick, clear answers instead of hunting through long explanations.
How do you fairly compare two baseball players?
Match role, position, and time frame, then look at rate stats and overall value, and only after that, factor in context like park and teammates.
What stats are most useful for judging two players?
For hitters, focus on OBP, SLG/OPS, and one value stat; for pitchers, use ERA plus strikeout, walk rates, and a value stat, with traditional box-score numbers as support.
How many plate appearances or innings do I need before stats mean anything?
Under ~100 PA or a few outings is very shaky; aim for at least 300–600 PA for hitters and 50–100 innings for starters before taking numbers seriously.
Is WAR enough on its own to judge a player?
No. WAR is only a summary number; use it as a rough impact check and then rely on the hitting, fielding, baserunning, or pitching details explained above.
How can I fairly match players from different eras?
Use era- and park-adjusted stats (OPS+, ERA+, wRC+) together with career and peak value, so you see how far above a typical player of that time each one stood.
What is JAWS, and why does it matter in Hall of Fame comparisons?
JAWS averages a player’s career and peak value and compares it to the typical Hall of Famer at that position, giving a fast check on whether their résumé is truly HOF-level.
Use it as a small checklist before you argue or hit publish, so each comparison feels more grounded, consistent, and easy to explain.
Learning to compare baseball players properly means looking beyond box scores and headlines—lining up roles, time frames, and context, then layering in the right mix of traditional and advanced stats. When you use that process, your debates, fantasy decisions, and Hall of Fame arguments all get clearer—and it becomes much easier to dream up rivalries and matchups you’d be proud to see on flags and decor from the FlagOh Fanatics.